Dynamic Data Example
Preview
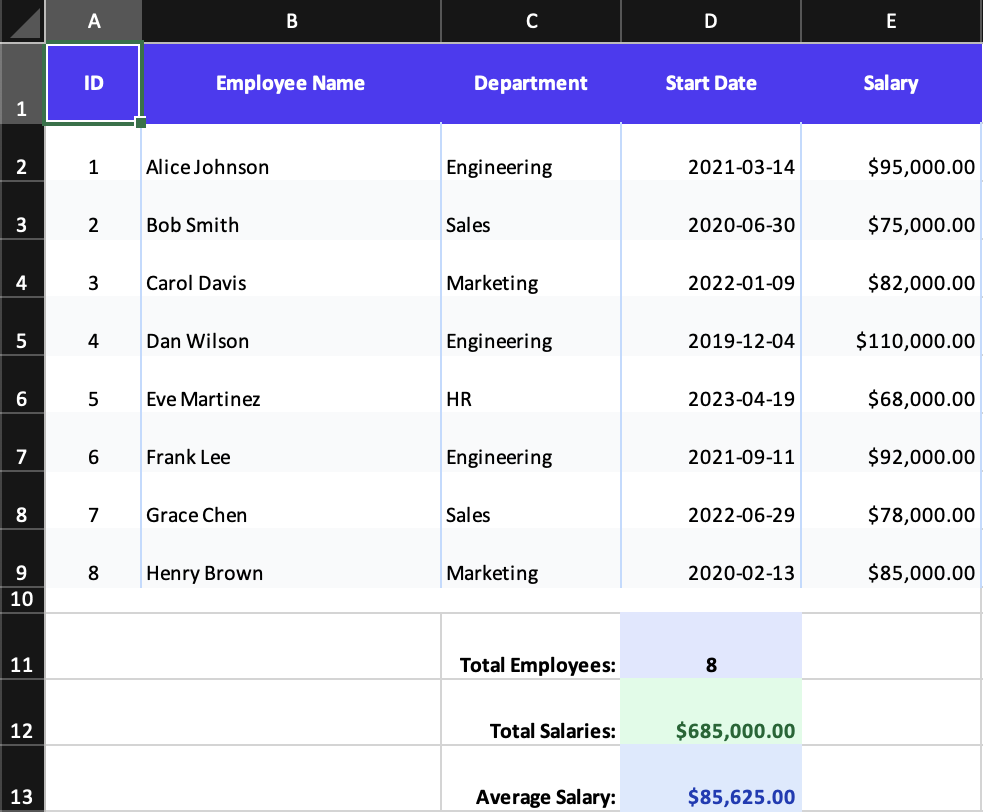
What it demonstrates
- rendering rows from application data
- column formats for dates and currency
- named ranges with column
id - formulas such as
SUM(Salaries)andAVERAGE(Salaries)
Why it matters
This example feels the most like production reporting code: data in, workbook out, with Excel-native formulas layered on top.
Source
examples/03-dynamic-data.tsx
/**
 * Dynamic Data Example - Generating Rows from Data
 *
 * This example demonstrates how to:
 * - Generate rows dynamically from arrays/data
 * - Use column formats (dates, currency)
 * - Apply formulas to cells
 * - Use named ranges with column IDs
 *
 * Run: npm run example:dynamic (or pnpm/bun equivalent)
 */

import { writeFile } from 'node:fs/promises';
import { Cell, Column, Group, Row, Workbook, Worksheet } from '../src/components';
import { renderToWorkbook as render } from '../src/renderRows';

// Sample employee data
const employees = [
  {
    id: 1,
    name: 'Alice Johnson',
    department: 'Engineering',
    startDate: new Date(2021, 2, 15),
    salary: 95000,
  },
  { id: 2, name: 'Bob Smith', department: 'Sales', startDate: new Date(2020, 6, 1), salary: 75000 },
  {
    id: 3,
    name: 'Carol Davis',
    department: 'Marketing',
    startDate: new Date(2022, 0, 10),
    salary: 82000,
  },
  {
    id: 4,
    name: 'Dan Wilson',
    department: 'Engineering',
    startDate: new Date(2019, 11, 5),
    salary: 110000,
  },
  {
    id: 5,
    name: 'Eve Martinez',
    department: 'HR',
    startDate: new Date(2023, 3, 20),
    salary: 68000,
  },
  {
    id: 6,
    name: 'Frank Lee',
    department: 'Engineering',
    startDate: new Date(2021, 8, 12),
    salary: 92000,
  },
  {
    id: 7,
    name: 'Grace Chen',
    department: 'Sales',
    startDate: new Date(2022, 5, 30),
    salary: 78000,
  },
  {
    id: 8,
    name: 'Henry Brown',
    department: 'Marketing',
    startDate: new Date(2020, 1, 14),
    salary: 85000,
  },
];

const workbook = (
  <Workbook>
    <Worksheet name="Employee Directory">
      {/* Column definitions with formats */}
      <Column width={8} />
      <Column width={25} />
      <Column width={15} />
      <Column id="StartDates" width={15} format="yyyy-mm-dd" />
      <Column id="Salaries" width={15} format='"$"#,##0.00' />

      {/* Header Row */}
      <Row height={30}>
        <Group className="font-bold text-white bg-indigo-600 text-center align-center">
          <Cell value="ID" />
          <Cell value="Employee Name" />
          <Cell value="Department" />
          <Cell value="Start Date" />
          <Cell value="Salary" />
        </Group>
      </Row>

      {/* Dynamic data rows */}
      {employees.map((emp, index) => (
        <Row height={22}>
          <Group className={`border-x border-blue-200 ${index % 2 === 0 ? '' : 'bg-gray-50'}`}>
            <Cell value={emp.id} className="text-center" />
            <Cell value={emp.name} />
            <Cell value={emp.department} />
            <Cell value={emp.startDate} />
            <Cell value={emp.salary} />
          </Group>
        </Row>
      ))}

      {/* Summary Section */}
      <Row height={10}>
        <Cell value="" colSpan={5} />
      </Row>

      <Row height={25}>
        <Cell value="" colSpan={2} />
        <Cell value="Total Employees:" className="font-bold text-right" />
        <Cell value={employees.length} format="0" className="font-bold text-center bg-indigo-100" />
        <Cell value="" />
      </Row>

      <Row height={25}>
        <Cell value="" colSpan={2} />
        <Cell value="Total Salaries:" className="font-bold text-right" />
        <Cell
          formula="SUM(Salaries)"
          format='"$"#,##0.00'
          className="font-bold bg-green-100 text-green-800"
        />
        <Cell value="" />
      </Row>

      <Row height={25}>
        <Cell value="" colSpan={2} />
        <Cell value="Average Salary:" className="font-bold text-right" />
        <Cell
          formula="AVERAGE(Salaries)"
          format='"$"#,##0.00'
          className="font-bold bg-blue-100 text-blue-800"
        />
        <Cell value="" />
      </Row>
    </Worksheet>
  </Workbook>
);

render(workbook).then(async (wb) => {
  const buffer = await wb.xlsx.writeBuffer();
  await writeFile('examples/output/03-dynamic-data.xlsx', Buffer.from(buffer));
  console.log('✅ Created examples/output/03-dynamic-data.xlsx');
});